Graphing Lab
Julia Banning and Megan Nanovic
9/30/15
|
Purpose:
The purpose of this lab is to utilize the graphs of position, velocity, and acceleration to determine the relationship between them and the kinematic equations that describe them. |
Theory:
In this lab, we utilized position, velocity, and acceleration versus time graphs to determine the velocity when the cart passed 75 and 15 centimeters on the ramp. The equations that are located on the various graphs allow us to discover the velocity of the cart at the specific points. Also, these equations permit us to identify the overall acceleration of the cart. On each graph, the slope formula, which is y=mx+b, enables us to find the velocity of the cart while passing the previously specified points of 75 and 15 centimeters. The kinematic equation related to the position vs. time graph is d=vit+1/2at^2, while the equation related to the velocity vs. time graph is Vf=vi+at. |
Experimental Techniques:

We attached the paper to the cart so that the timer could produce marks on the paper in order for us to measure and produce graphs from the measurements. |

We then aligned the paper along a meter stick so that the first clear mark that the timer produced is lined up with zero centimeters. We proceeded to measure how far each individual mark was from zero centimeters. |
Data and Analysis:
|
Sample Calculations
Velocity
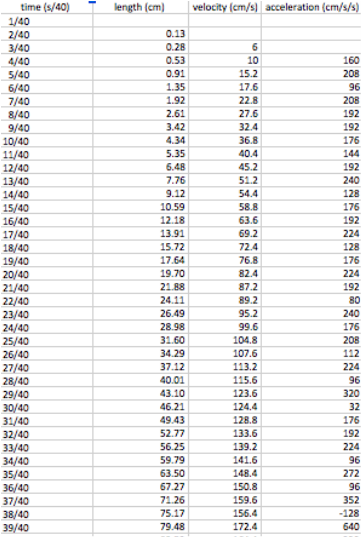
1. (length of one object) - (length of previous object) / .025 2. (.28 cm) - (.13 cm) / .025 3. Velocity = 6 cm/s Acceleration 1. (velocity of one object) - (velocity of previous object) / .025 2. (10 cm/s) - (6 cm/s) / .025 3. Acceleration = 160 cm/s/s |
Graphs

Position vs. Time
The acceleration of the cart = 172.4 cm/s/s

Velocity vs. Time
Velocity of cart as it is passing 75 cm = 90 cm/s
Velocity of cart as it is passing 15 cm = 170 cm/s

|
Acceleration vs. Time Accereleration=175 cm/s/s |
|
Conclusion
During this lab, position, velocity, and acceleration graphs were manufactured after taking measurements from the tape that our timer placed marks on. The acceleration of the cart is not constant because the difference of one acceleration from the previous acceleration is not equal every time. Also, if the acceleration was constant, the acceleration vs. time graph would be a straight line, but it clearly is not. There are certain kinematic equations that relate to the position and velocity versus time graphs. The equation of d=Vit+1/2at^2 relates to the position vs. time graph because we know all of the variables, which will allow us to rearrange the equation in order to find the acceleration. The equation vf=vi+at relates to the velocity vs. time graph because it allows us to identify the velocity of the cart at 75 and 15 centimeters. Friction, in this particular case, does not impact the outcome of this lab, considering the fact that the cart was specifically built to entail less friction and the ramp had relatively smooth slots for the wheels of the cart to roll on. The smoothness of the graphs decreases because as the units of measurement get smaller, the chance of variability of the graph increases. We begin with just centimeters, then we go down to cm/s, and then even smaller, cm/s/s. Since the units continuously become smaller, the points on the graph will spread out easier and more frequently. Overall, this experiment taught us how to determine acceleration and velocity utilizing the graphs of motion. References: Physics Textbook Online research http://lahsphysics.weebly.com/pva-graphs-lab.html |
|
